TwV Multi-timeframe Dynamic VRVPMulti-timeframe Dynamic Visible Range Volume Profile
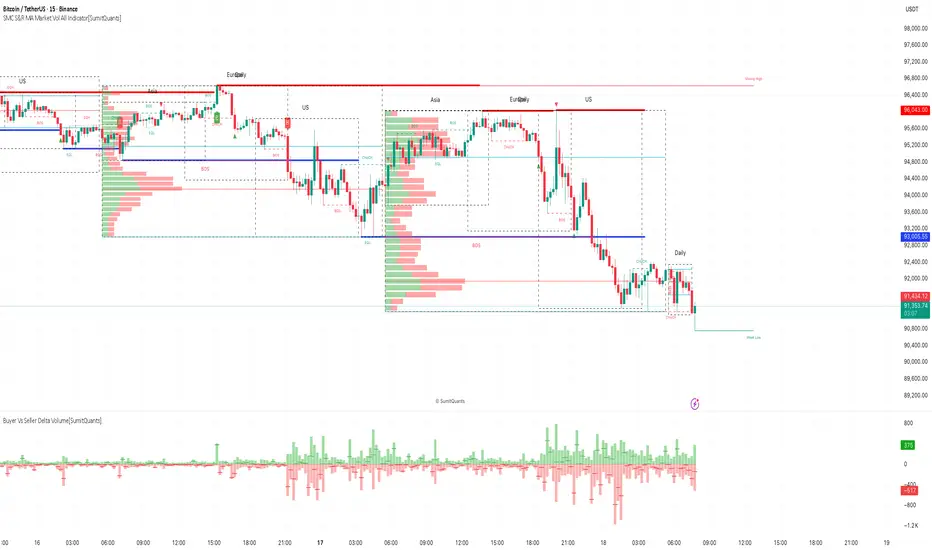
The volume profile is an indicator that displays trading activity over a specified period and plots a histogram on the chart which reveals dominant and significant price levels based on volume and in essence gives a clear indication of Supply or demand at a certain price rather than volume in a certain period.
What makes this VRVP indicator different from other is that it is multi-timeframe and dynamic, meaning that it has the ability to show the POC for a higher timeframe and that it also recalculates the main POC every single time traders adjust the chart.
Most VRVP need to be adjusted to a fixed position for the Main POC, I made an improvement by giving the indicator the ability to identify the bars that are being look at in the screen, this really gives traders the possibility and agility to identify potential support and resistance areas without the need to be changing any settings on the indicator.
Furthermore, giving the ability to the indicator to be multi-timeframe allows traders not only to work with a point of control in one timeframe, but also have a dashed line plotting the Point of Control of a HIGHER timeframe, which could potentially be a strongest support or resistance. The multi-timeframe point of control is fixed only.
This VRVP is completely similar to the official Trading View paid subscription one.
Fundamentals
Point of Control (POC): The price level for the time period with the highest traded volume. The POC is represented by an amber line within the indicator.
Profile High: The highest reached price level during the specified time period
Profile Low: The lowest reached price level during the specified time period.
Value Area (VA): The range of price levels in which a specified percentage of all volume was traded during the time period. Typically, this percentage is set to 70% however it is up to the trader’s discretion.
Value Area High (VAH): The highest price level within the value area.
Value Area Low (VAL): The lowest price level within the value area.
Usage
The Resistance and Support levels can be provided by the Volume profile using a reactive method so they constantly change with price action and give a clearer picture to predict future price movements. The Reactive method relies on past price movements at certain price levels and applies a more significant understanding of price reaction at certain meaningful levels
Support levels will be areas where price will be supported on the way down.
Resistance levels will be areas that resist price on the way up.
A basic understanding of this is that Buyers will enter the market at the bottom of a profile and sellers will enter the market at the top of the profile.
Configuration
By the default the indicator has enabled plotting the charts timeframe Volume Profile.
Multi-timeframe option needs to be enabled and desired timeframe chosen from selector menu.
Bars back value for fixed calculation of the multi-timeframe point of control.
Traders can adjust default settings as follows:
Charts timeframe VRVP
Main POC color – Yellow
Positive Volume – Green
Negative Volume – Red
VRVP Width – 100 (Refers to the plotting width for better suiting on small screens)
Multi timeframe VRVP
Enable or disable calculations
Bars back - Fixed numbers of bars for calculation (Consider that max bars back limit is 5000, but it considers 5000 bars on the current charts timeframe, therefore traders need to take into consideration converting number of bars in higher timeframe to charts timeframe)
e.g.
Charts timeframe 15m – MTF desired 1H
1H = 60 min 15m = 15 min – 100 bars back equivalent to (60 min * 100) / 15 = 400
Lower than 5000 then calculations takes place, otherwise calculations will be disabled.
Multi-timeframe POC color = Light blue DASHED
Timeframe desired – 1H by default
Summary box
Enable or disable box
Box shows information regarding the exact price where Main POC and MTF POC reside
Table Size for better fitting on mobile devices
able Position for adjusting to each trader’s preference or use in combination with other indicators
Penunjuk Pine Script®